



What Is It?
The TAM/SAM/SOM Blueprint is a market-sizing framework that helps founders calculate Total Addressable Market, Serviceable Addressable Market, and Serviceable Obtainable Market the way investors expect to see them: built bottom-up from real operational inputs, validated against named sources, and assembled into a 60-second market story.
Across five stages, it replaces the “1% of a $10B market” fallacy with numbers a founder can defend. It is built for founders preparing to raise, from pre-seed through Series B. It is delivered as an interactive, fillable PDF you can complete on screen or print and fill in by hand — an instant digital download.

Format
Interactive, fillable PDF. Type your answers directly into it on screen, or print it and fill it in by hand. For on-screen use, open it in Adobe Acrobat or Reader so your entries save. Instant digital download — no physical item is shipped.

Overview
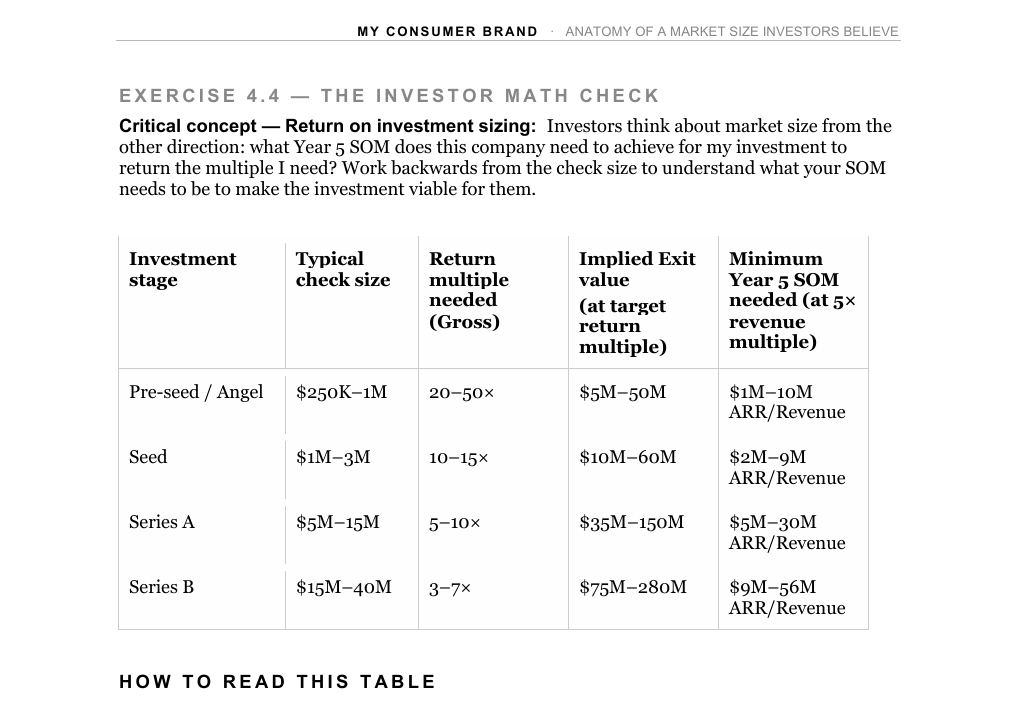
Investors don’t reject market-size slides because the number is small. They reject them because the logic is weak, the source is unverifiable, or the founder clearly doesn’t understand the market. “Our market is $47 billion” impresses no one. “Here’s the exact segment, here’s how we sized it, here’s the source, and here’s the logic to what we can win in five years” gets the next meeting. This blueprint is that logic, made repeatable.

What’s Inside?
- Clear, defensible definitions of TAM, SAM, and SOM and the relationship between them.
- The bottom-up build for SAM and SOM from distribution, conversion, and pricing — not a percentage of a report.
- The market-data credibility ladder for citing named, verifiable sources.
- The fix for the “1% of TAM” fallacy that lands decks in the no pile.
- A 60-second market story with a source for every number — ready for your pitch deck and financial model.
Who It’s For?
Startup founders raising pre-seed through Series B; consumer-brand founders in CPG, DTC, and wellness who need market size investors will believe; anyone whose market slide has been challenged or quietly ignored.
How It Works?
Five stages take you from definitions to a fully sourced, investor-ready market narrative. Most founders complete it in one focused session.
The Outcome
Numbers you can defend cold — the exact figures that flow into your pitch deck, your investor narrative, and your financial model.
A marketing framework that's clear, credible, and founder-ready.
frequently asked questions
What are TAM, SAM, and SOM?
TAM is the total demand if everyone bought; SAM is the portion you can realistically reach with your model and geography; SOM is your Year-5 revenue — what your go-to-market engine can actually capture.
How do you calculate SOM?
Bottom-up from operations — distribution reach, conversion, retention, and price — not as a percentage of SAM.
Why is “1% of a $10B market” a mistake?
It shows no mechanism. Investors need to see how you get there, not a percentage applied to a big number.
Does this work for non-CPG businesses?
Yes. The blueprint includes worked examples for CPG, B2B SaaS, and MedTech.
What sources count as credible?
Your own data, named industry associations, and government datasets rank highest; undisclosed industry estimates rank lowest.
Is this a fillable PDF, or do I print it?
Both. It’s an interactive, fillable PDF — type your answers directly into it on screen, or print it and fill it in by hand. For on-screen use, open it in Adobe Acrobat or Reader so your entries save (some browser and phone previewers won’t save typed text). It’s an instant digital download.
About the author — Tapasya Bali
Two-time founder, startup advisor, and investment banking veteran; Founder & CEO of 100Cal Snacks. Recognized by Goldman Sachs (100 Most Intriguing Entrepreneurs) and BizJournal (Upstart 100). The MCB Blueprint Series is built from the exact frameworks she uses with founders every week — not theory, not templates.

NEXT IN SERIES
Save when bundled – included in the Fundraising Kit and Ultimate Founder Kit.
